Claritev (CTEV)·Q4 2025 Earnings Summary
Claritev Caps Turnaround Year with Fourth Straight Beat, Stock Jumps 6%
February 23, 2026 · by Fintool AI Agent
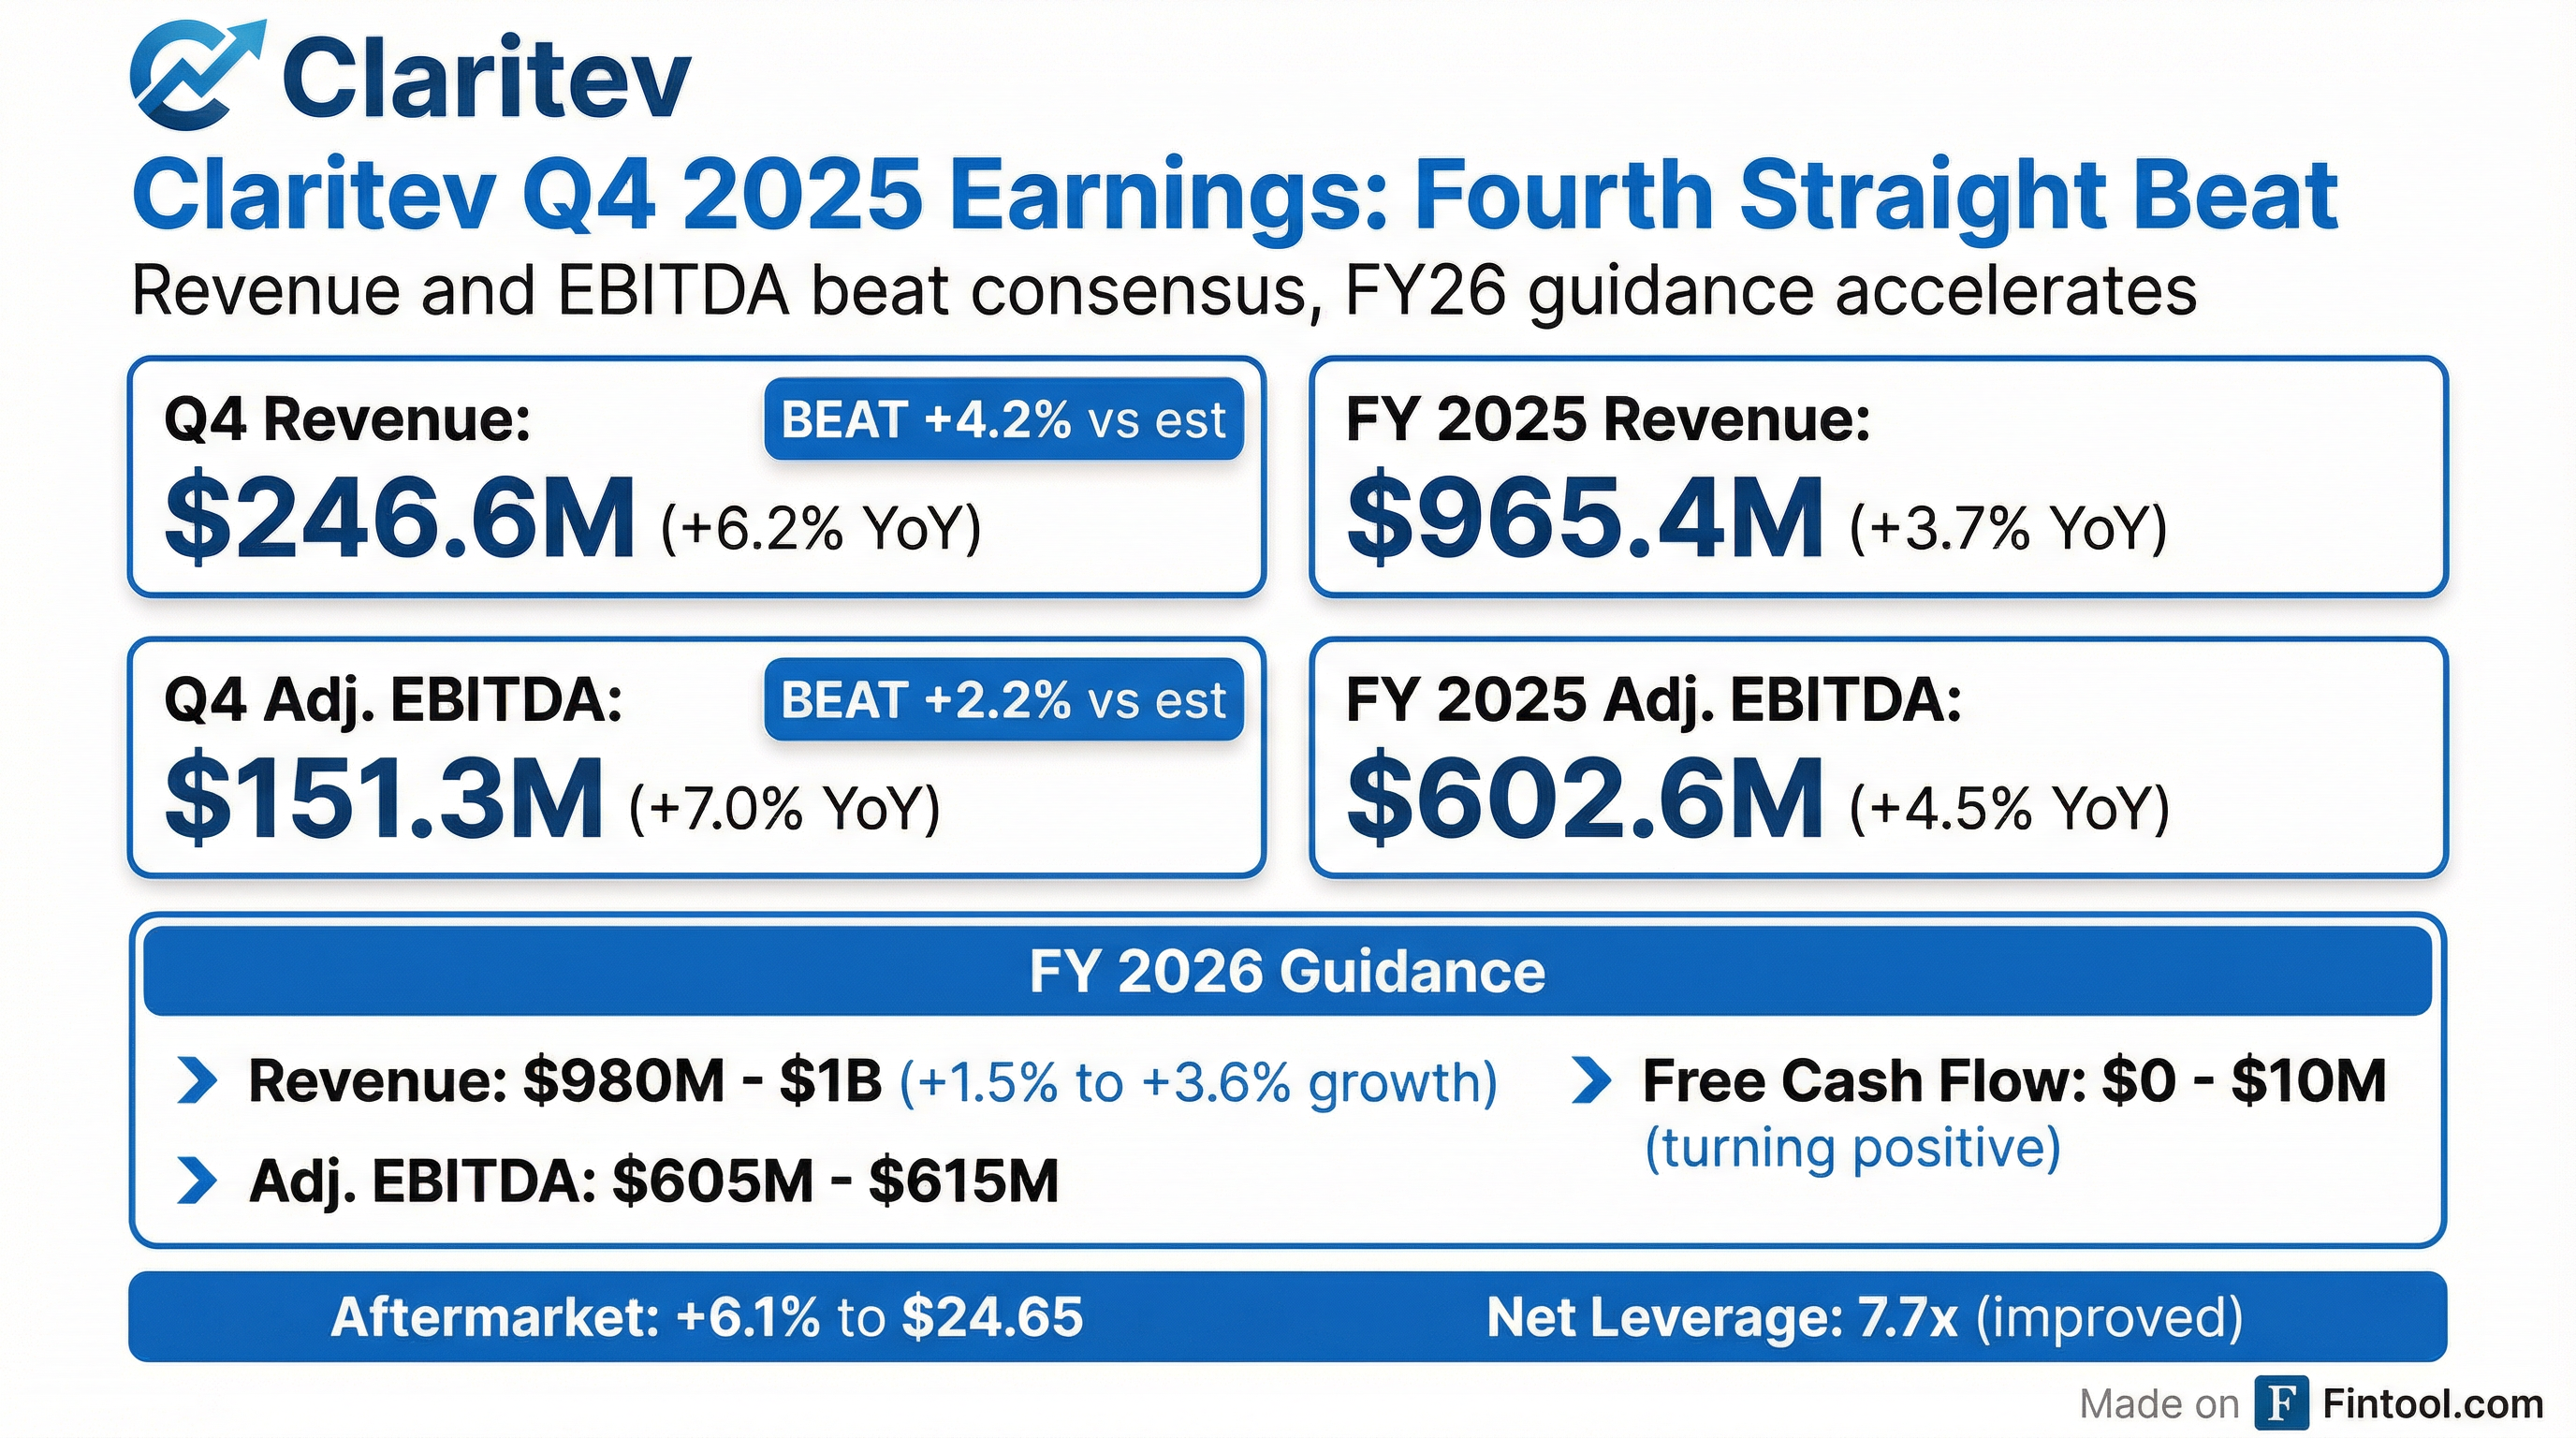
Claritev Corporation (NYSE: CTEV) delivered its fourth consecutive quarterly beat, capping what management called "the Year of the Turn" with Q4 2025 revenue of $246.6M (+6.2% YoY) and Adjusted EBITDA of $151.3M (+7.0% YoY). The healthcare technology company exceeded consensus on both metrics, and shares jumped 6.1% in aftermarket trading to $24.65.
Did Claritev Beat Earnings?
Yes — decisively. Q4 2025 marks the fourth straight beat after five consecutive quarters of misses.
Full Year 2025 Results:
Beat/Miss History: The Complete Turnaround
The turnaround is now undeniable. After 5 consecutive misses from Q4 2023 through Q4 2024, Claritev has strung together 4 straight beats throughout 2025.
What Did Management Guide for 2026?
FY 2026 guidance signals continued momentum with improving cash generation.
Key takeaway: FCF is expected to turn positive for the first time, a critical milestone for this heavily leveraged company.
Revenue by Segment: Where Growth Came From
All three service lines grew in Q4 2025, with Network leading the way.
Network (+11.9% YoY) continues to be the growth engine, driven by P&C commercial arrangements and channel expansion.
Operational KPIs: Claims Processing Volume
PSAV Revenue Analysis: Rate, Volume, and Mix
The company disclosed detailed PSAV (Percentage of Savings) metrics showing improving unit economics.
Key drivers:
- Medical inflation driving higher charges per claim
- AI initiatives improving % of actionable claims
- Claims with identified savings rose sequentially from Q3 to Q4
How Did the Stock React?
Context: The stock is down significantly from its 52-week high of $74.07 (reached in mid-2025), but has rebounded sharply from its $12.86 low. Today's aftermarket move continues the pattern of positive earnings reactions throughout 2025.
Balance Sheet: Leverage Improving But Still Elevated
Debt Structure Breakdown:
The 7.7x leverage ratio is down from ~8x+ in prior quarters, reflecting EBITDA growth. Management's capital allocation priorities: (1) organic investments for Vision 2030, (2) debt paydown, (3) value-creating M&A, (4) share buybacks.
Cash Flow: Progress Toward Positive FCF
Key insight: Q4 2025 FCF of $36.4M was the strongest quarter of the year, supporting the FY26 guidance for positive FCF.
What Changed From Last Quarter?
Margin note: The Q4 EBITDA margin of 61.4% was lower than Q3's 63.1%, likely due to transformation costs ($15.4M in Q4 vs $13.9M in Q3) and seasonal factors.
GAAP to Non-GAAP Reconciliation
Key adjustments from Net Loss to Adjusted EBITDA (Q4 2025):
Transformation costs of $16.9M for FY 2025 are related to the "Vision 2030" multi-year transformation program.
What Did Management Say?
CEO Travis Dalton:
"I am exceedingly proud of the work delivered by the Claritev team in 2025. This year marked a pivotal time in our company's history, as we returned to top line revenue growth highlighted by operational and financial execution. We expanded our vertical markets, rebranded as Claritev, launched new solutions and partnerships, and migrated our technology foundation, all of which combined to help us deliver record bookings. The Year of the Turn was an unqualified success, and we are well on our way to delivering on our theme of 2026 as The Way Up."
On competitive positioning:
"Our fundamental belief is that increased transparency, better data and technology, providers and employers will lead to more alignment and better decision-making... The moat is no longer code. It is the data, workflow, distribution, and trust that will matter the most."
CFO Doug Garis:
"We are carrying the momentum from our strong fourth quarter and full year results into 2026. Our guidance reflects a sustainable growth model, built on a durable core business foundation, exciting expansion opportunities, and a growing pipeline across our solutions and markets. Significantly, we expect to return to positive free cash flow in 2026, allowing Claritev to focus on our primary capital allocation priorities of driving organic growth, opportunistic debt reduction, and value-creating M&A."
Strategic Priorities: Vision 2030
Management outlined capital allocation priorities for 2026:
Guiding Principles:
- Diversify & Accelerate — Expand solutions, verticals, and channels to drive growth
- De-lever and De-risk — Improve cash flow, provide operating flexibility
Capital Uses (in priority order):
- Organic investments to fuel Vision 2030 Plan
- Debt paydown
- Value-creating M&A
- Share buybacks
New: Share Repurchase Program
The Board approved a $75 million, five-year share repurchase program starting January 1, 2026 through December 31, 2030, with a $20 million annual limit.
Repurchases may be made through open market transactions, privately negotiated transactions, or preset Rule 10b5-1 trading plans. The program can be extended, suspended, modified, or discontinued by the Board at any time.
Sales Motion: Record Bookings Performance
Q4 capped a breakout year for Claritev's go-to-market engine.
2026 Outlook: Management expects strong double-digit ACV bookings growth in 2026, with revenue conversion beginning late 2026 and accelerating into 2027.
Key wins highlighted:
- Renewed top clients with expanded NSA and Payment & Revenue Integrity solutions
- Continued momentum in TPA and broker verticals with new client acquisition
- Two additional clients signed in the Middle East, expanding international footprint
- New logo acquisition across vertical markets
Competitive Moat: Five Pillars
CEO Travis Dalton outlined five core competitive advantages that he believes position Claritev to win:
- Comprehensive Network — 1.4M+ provider network built over 40+ years, one of the "least appreciated assets"
- Deep Workflow Knowledge — Client relationships and domain expertise driving renewals and sales growth
- Proprietary IP — Data analysis capabilities, flexibility to adapt, and technology scale
- High Provider Acceptance — Greater than 90% acceptance rate across solutions
- Regulatory Expertise — 40+ years navigating state and federal healthcare regulations
AI Strategy: Positioned for Disruption
Management dedicated significant time to AI positioning, noting three core ingredients required to win in the AI era:
Current AI deployments:
- Surprise Bills processing automation
- Payment and Revenue Integrity products
- Workflow automation around credentialing
- Improving % of actionable claims identified
Key quote: "The moat is no longer code. It is the data, workflow, distribution, and trust that will matter the most. Simple tools will go by the wayside. The long-term winners will be platforms that support rich workflow."
Management plans to go deeper on AI at the March 16 Investor Day.
New Solution: Network Builder
Claritev introduced Network Builder, a digital transformation-enabled solution leveraging the company's 1.4M provider network:
- Clients can access the full network or create specifically tailored narrow networks
- Addresses geographic needs, niche facilities, or rural access gaps
- Creates bespoke networks in minutes vs. the previous lengthy manual process
- Will be showcased at the March 16 Investor Day
Q&A Session: Technical Difficulties
The Q&A portion of the earnings call was cut short due to persistent technical difficulties with the phone lines. While the webcast audio functioned properly, participants calling in could not hear the speakers. After multiple troubleshooting attempts, management ended the call and offered to follow up directly with investors via [email protected].
The company noted it would post a transcript of prepared remarks on the investor relations website.
Key Takeaways
-
Turnaround complete: Four consecutive beats after five straight misses validates the "Year of the Turn" narrative
-
FCF inflection: Q4 FCF of $36.4M and FY26 guidance for $0-$10M positive FCF marks a critical milestone
-
Leverage improving: Net debt/EBITDA down to 7.7x from 8x+, though still elevated
-
All segments growing: Network (+11.9%), Payment & Revenue Integrity (+3.2%), Claims Intelligence (+5.1%) all positive in Q4
-
Unit economics strengthening: Revenue per claim up 17.9% YoY driven by medical inflation and AI initiatives
-
Record bookings year: $67M ACV booked in FY25, with 100+ deals over $100K (up 30% YoY) and average deal size up 50%
-
AI-enabled growth: Management positioned AI as core to competitive moat, with deployments in Surprise Bills, Payment Integrity, and workflow automation
-
2026 setup reasonable: Guidance implies modest growth (~2-3%) with continued focus on deleveraging